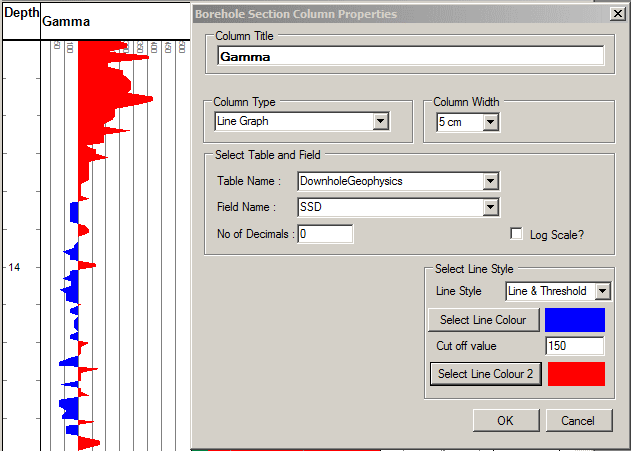
Line Graph Column
Line graph columns can be used to display numeric data, and is particularly useful for point measurements such as downhole geophysics.
Options are:
- Column Title - Any text title
- Column Width
- Table name and field name - Source of data
- Number of decimals
- Log Scale - display as natural log values (base e)
- Font
- Line Style
1. Line -Single line of specified colour.
2. Filled Line -Filled line of specified colour.
3. Line & Threshold - 2 different colour filled lines, above and below a cutoff value.

page revision: 1, last edited: 19 Jan 2018 07:29